TRENOplus

The better way of planning

The next generation of timetable planning.

TRENOplus is a powerful timetable planning tool developed from scratch to take maximum advantage of the latest research in network analysis modelling and algorithms. It integrates a macroscopic model and the trenissimo microscopic model into a package that supports users in estimating running times for use in planning timetables and infrastructure at different levels of detail.

The microscopic model allows users to not only view the line and station usage based on pre-defined headway times, but these times can be automatically and accurately estimated based on the real position of signals. Results are displayed on the graphic timetable in terms of blocking times steps.

TRENOplus is based on a scalable database management system supporting any number of trains and the shared use of a data.

Reasons to use TRENOplus

Accuracy & Ease

Choosing between accuracy and ease? With its Micro-Macro approach TRENOplus combines them!

Powerful

TRENOplus has been successfully tested in several Countries, proving robust even with the largest datasets.

Microscopic

The running times are calculated in highest detail on the microscopic infrastructure model, which includes the complete network, including all signals.

Integrated

Timetables planned with TRENOplus can be quickly tested in trenissimo

Complete

From the export of passenger timetables, to the visualisation of blocking times and the rostering.

Flexible

Our team is glad to implement new functions to adapt TRENOplus at best to your needs

Main features of TRENOplus

Completely new and innovative, TRENOplus features a full range of tools and outputs that support planners at different levels of timetable planning. Extremely robust, based on a scalable database management system supporting any number of trains and the shared use of a data set even in the basic version.

Time is nature’s way of making sure everything doesn’t happen at once.

Ray Cummings

Running Time Calculator

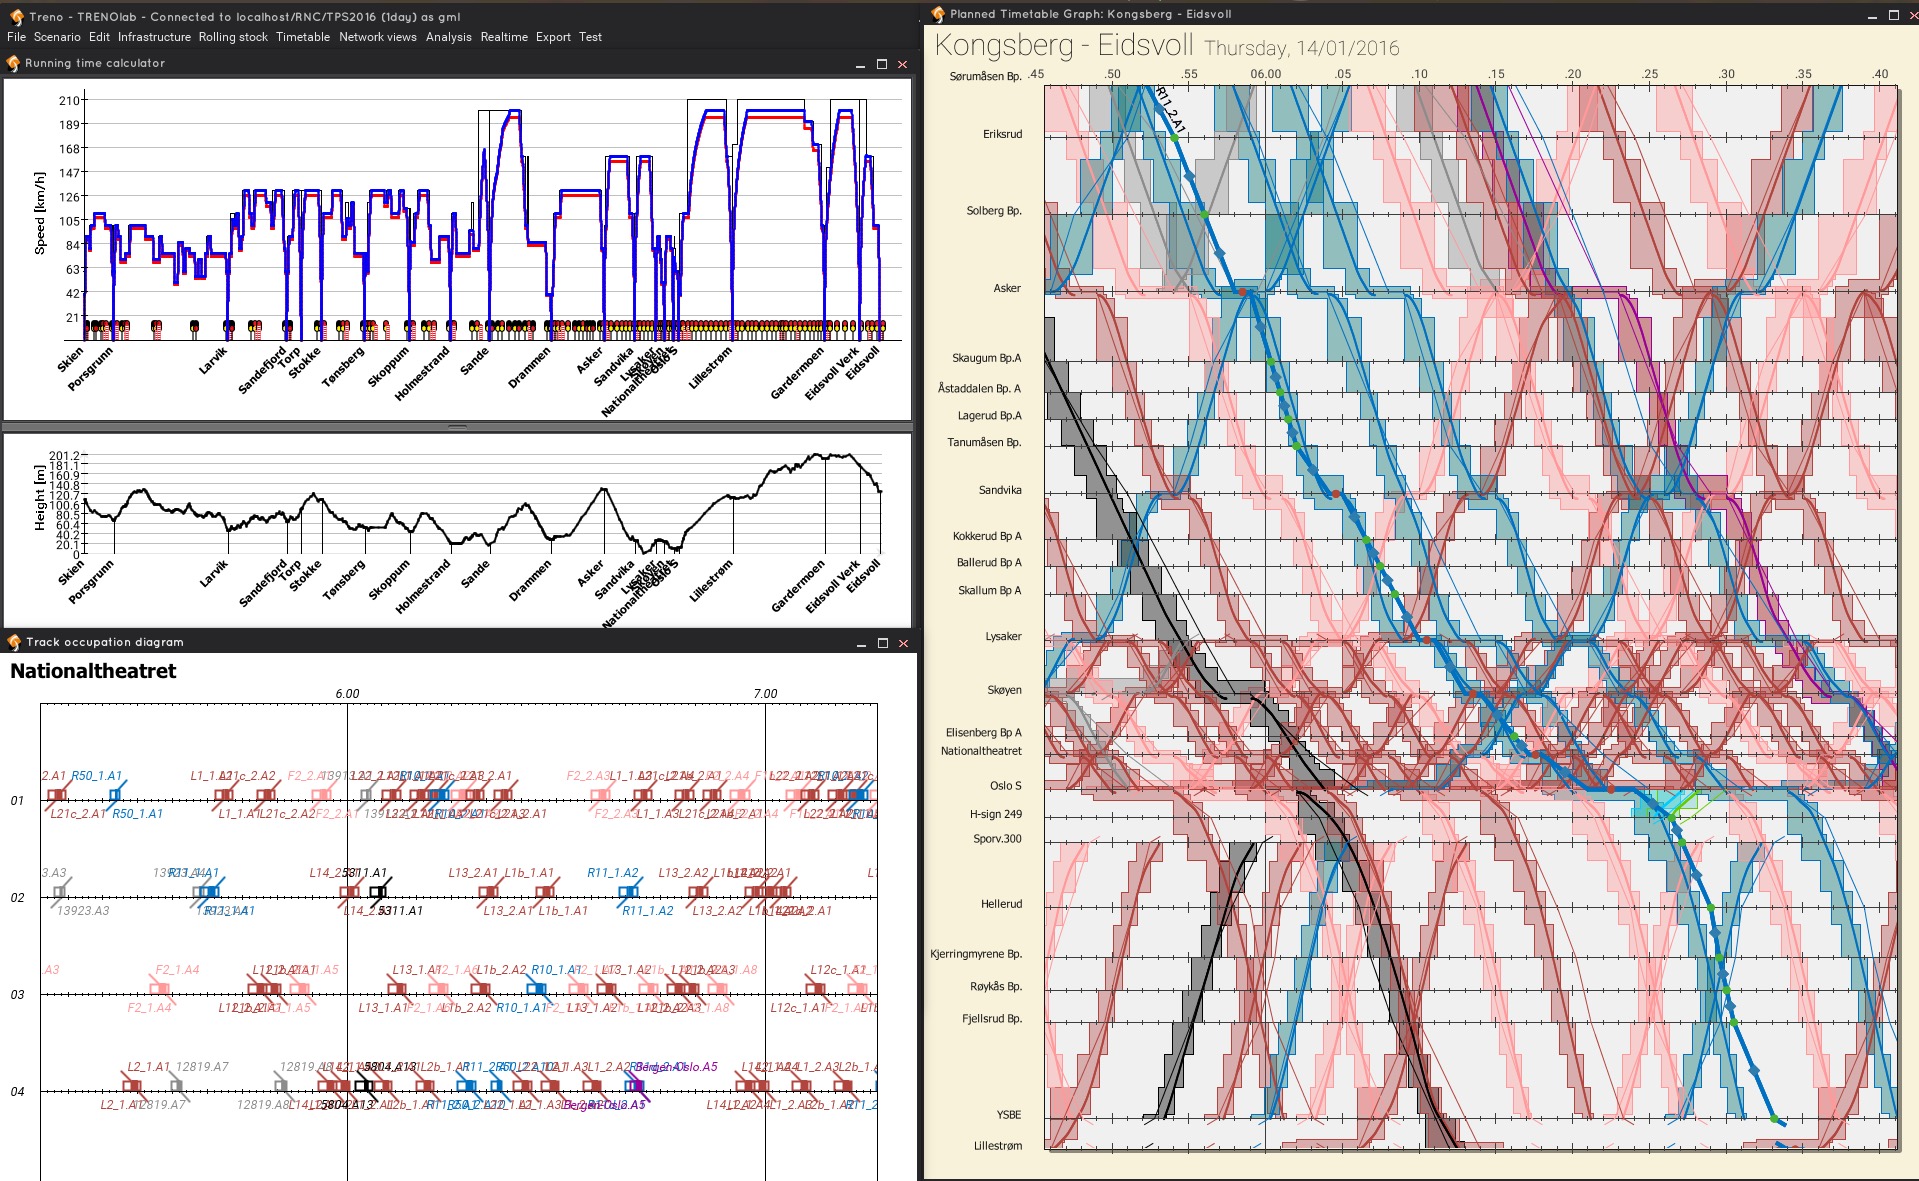
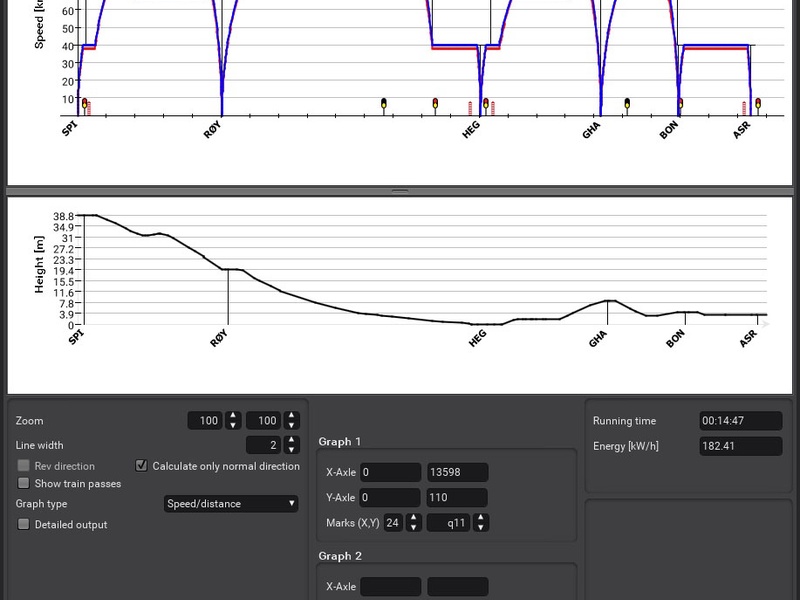
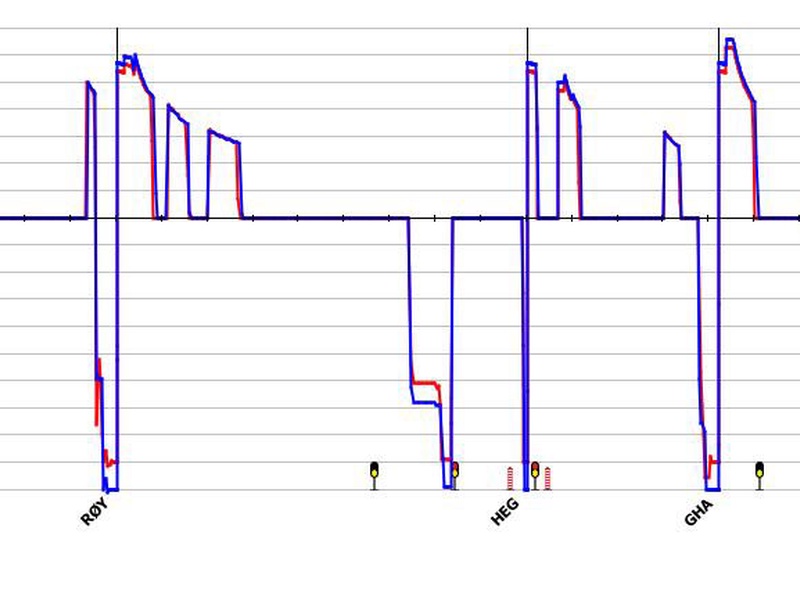
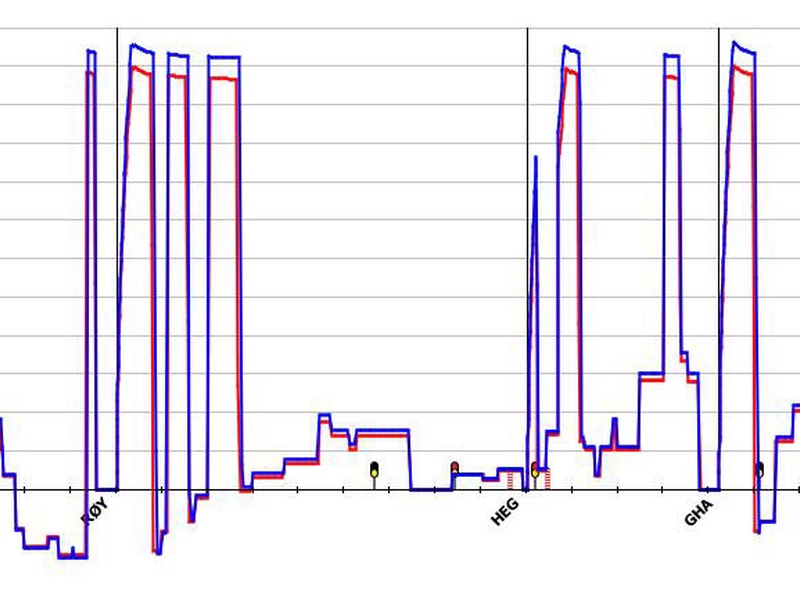
Estimating running times with the highest detail is a key element in timetable planning, since well-estimated running times are a basic element for smooth operations. The Running Time Calculator enables an accurate estimation for any kind of trainset, considering the curves and gradients as well as a realistic behaviour of drivers, modelled on the basis of a research project that has been awarded at international level. Loading the needed data is simple and requires only a few simple steps. The results can be viewed in various diagrams, showing, among others, not only the speed, but also the acceleration and the energy consumption.

Features

  • Quick, intuitive definition of locomotives & trainsets;
  • Model an entire line in a few minutes;
  • Flexible configuration of train performances;
  • Output automatically used in the timetable;
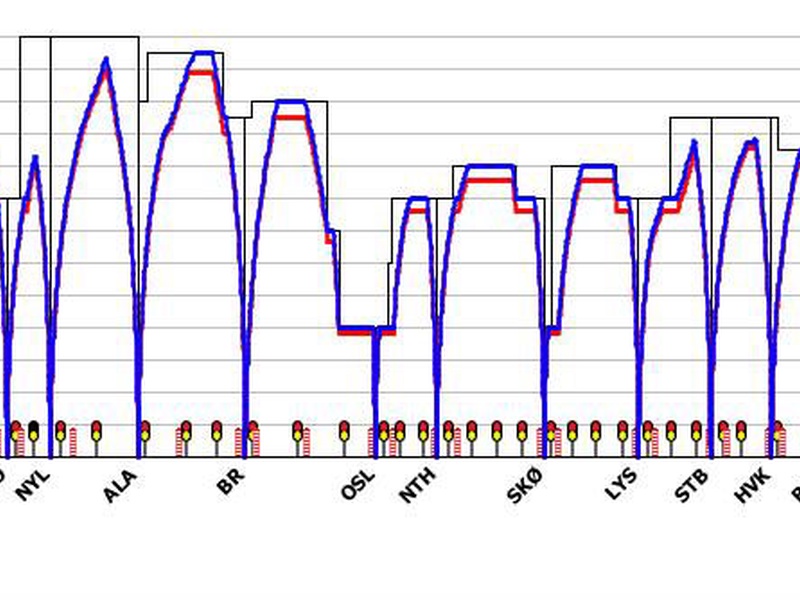
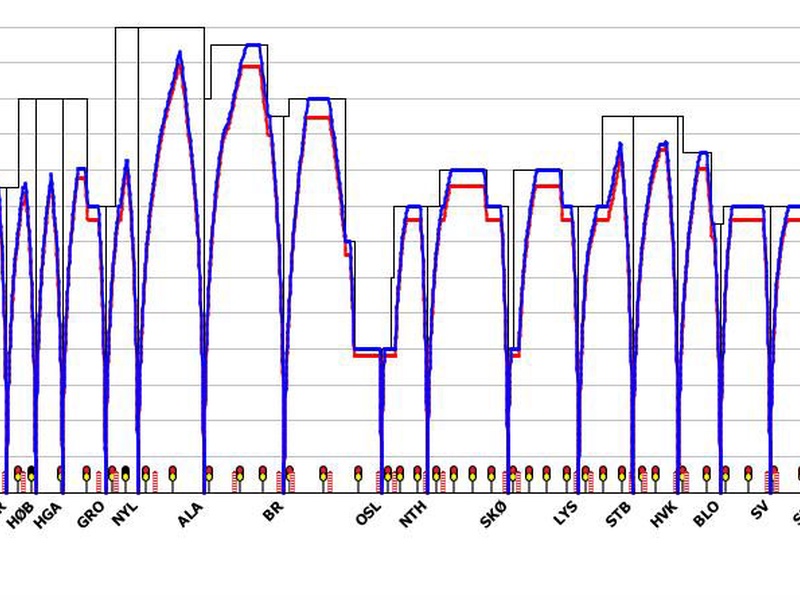
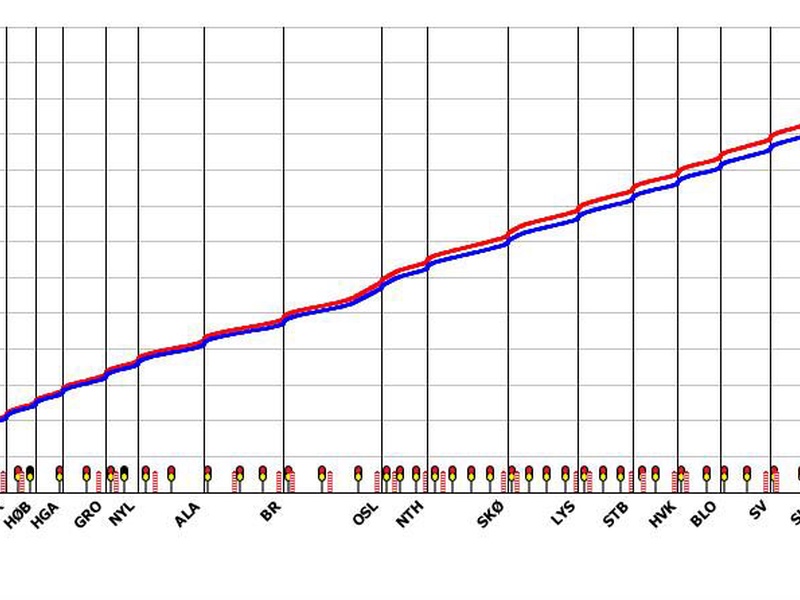
  • Various diagrams, such as speed or energy consumption vs distance;
  • Export as pdf, drawing and picture;
  • Log file recording all calculated parameters;

I prefer drawing to talking. Drawing is faster, and leaves less room for lies.

Le corbusier

Graphic Timetable

Graphic timetables are the most common way to represent train operations: timetable planners can immediately point out the critical points of a timetable by simply looking at it. In TRENOplus, timetable graphs can be customized with a series of options and include the representation of the infrastructure usage.

Depending on the detail you choose when defining the network, occupation can be shown as blocking or headway time between trains, allowing a quick overview of the residual capacity. Zooming and other flexible settings allow customizing the graphic settings of the timetable, and a variety of output formats ensures the graph will always be attractive. When the highest editing flexibility is required, the graphic timetable is exported as drawing to be completely modified using third-party software.

Features

  • Planned and calculated running times;
  • View the conflicts among trains;
  • Calculate the blocking times;
  • Usable on any user-defined corridor;
  • Filters for operating days and validity periods;
  • Edit a train within a graphic timetable;
  • Zooming and flexible graphic editing;
  • Export as drawing, PDF or high-resolution image in various formats.

The best thing about the future is that it comes only one day at a time.

Abraham Lincoln

Calendar

In long-term planning studies, a single standard day is sufficient to develop timetables. However, when it comes to short-term planning, greater detail is required to accurately define timetables in response to temporary alterations, such as weekend variations and additional or cancelled trains. A complete Calendar module is integrated into TRENOplus with the aim to allow the definition of any combination of operating days for timetables, whether created from scratch or imported from third-party tools.

Features

  • Global visualization of the operations for any calendar date;
  • Easy definition of operating/non-operating days thanks to calendar view;
  • Quick definition of simple operating periods;
  • Full support of RailML operating days;
  • Full support of complex operating days;
  • Full support of train runs longer than 24h.

Even if you’re on the right track, you’ll get run over if you just sit there.

Will Rogers

Platform occupation

With the increasing demand for short-distance services in the busiest networks, stations are often operated at their saturation level. It is therefore fundamental to define the allocation of tracks, their occupancy, the shunting movements and the arrival/departure times in order to plan the best possible timetable. The platform occupation tool allows simple editing with drag&drop of the train platform assignment; the diagram can be exported as drawing or high-resolution image in a variety of formats.

Features

Global visualization of track occupation; Possibility to use default rule-based assignment; Visualization of conflicts; Visualization of total occupation; Graphic editing; Graphic definition of turnarounds; Graphic definition of shunting movements.

Somewhere there is a map of how it can be done.

Ben Stein

Network View

When working on complex and/or large networks, having a clear view over lines and station is fundamental to understand how they are structured and how trains are routed. Moreover, the possibility to create attractive images with just a few clicks, using various maps as backgrounds, consistently increases the communicability of the projects, with an intuitive and self-explaining description of the network.

TRENO allows viewing the network at three levels of detail:

  • a “Geographic" network, showing the lines and stations on a map.
  • a “Macroscopic” network, simplified to show large areas in a single image.
  • a “Mesoscopic” network, in which the position of all signals, gradients, tunnels and speed limits can be displayed.

Features

Geographically accurate, simplified, or detailed: one for any possible need! Visualization of any part of the network; Simple editing; Visualization of complex layouts; Visualization of train itineraries; Google and OpenStreetMap backgrounds; Graphic definition of station coordinates.

Believe in your infinite potential. Your only limitations are those you set upon yourself.

Roy T. Bennett

Capacity Estimation

This timetable-independent tool allows a nearly-automatic network-wide capacity estimation based on the network model and the characteristics of the rolling stock.

The module estimates the capacity of single- and double-track lines using the UIC 405 approach, based on the headway times automatically obtained from the blocking times of TRENO.

Features

  • Quick network-wide capacity estimation;
  • Estimate the capacity usage of any time band;
  • Results are visualised on the network map, which can be saved as image, drawing or pdf
  • Results are exported as detailed and aggregated Excel worksheets

You only get one life. It’s actually your duty to live it as fully as possible.

Jojo Moyes

Rostering

TRENOplus includes a simple function to estimate and visualise the unit diagrams of the trainsets used in a timetable.

Features

  • Quick estimation of the required number of trains or units
  • Results are visualised as a diagram, which can be saved as image, drawing or pdf
  • Results are exported as detailed and aggregated Excel worksheets

Productivity is never an accident. It is the result of a commitment to excellence, intelligent planning and effort.

Paul J. Meyer

An integrated approach

TRENOplus, trenissimo and TRENOanalysis are the perfect integrated tools for planning, analysis and simulation: taking advantage of their seamless integration planners can analyze real traffic data, plan or improve timetables, test them using the most accurate simulation model and finally view the results in various attractive diagrams.

In an integrated workflow, planners can:

  • Import and analyze real operational data (TRENOanalysis);
  • Modify or create a new timetable (TRENOplus);
  • Push the data to the simulation tool (TRENOplus);
  • Perform multiple simulations (trenissimo)
  • Compare simulated scenarios (TRENOanalysis).

This integrated approach is beyond any doubt to be the best one for planning and testing timetables, leading to a sensible reduction of the time required to perform a study and also to a consistent improvement in the level of detail.

Get a test drive of trenissimo

trenissimo is a new tool designed to make the train simulation more intuitive, accurate, and effective. Intuitive thanks to a smart, comfortable, state-of-the-art user interface. Accurate thanks to its ability to fully consider everyday variations in railway operations. Effective thanks to its integration in the TRENO suite, which significantly reduces the time needed to setup and perform railway planning and simulation. Discover it at InnoTrans!
Discover more about trenissimo